Air pollution is one of the main environmental problems in large cities. To find new solutions we need to measure the air quality first. Optical measurement technologies improve accuracy.
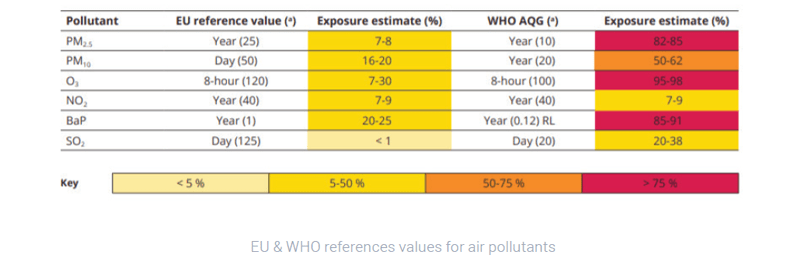
About 21% of the European urban population is exposed to concentrations of PM10 (particles with a diameter of 10 μm or less) above the limit value established by the European Environmental Agency. 53% of the same urban population was exposed to concentrations exceeding the stricter WHO AQG value for PM10 in 2015. The percentage of the urban population exposed to levels above the WHO annual AQG (20 μg/m3) ranged between 50% and 92% in 2000-2015. The urban population’s exposure to levels above the more stringent WHO AQG for PM2.5 fluctuated between 82% and 97% in 2006-2015.
In the remainder of this document we’ll give examples focusing on one of the constituents being NO2, PM …
Measure what matters
If we really want to know how our air quality is, we need to start measuring it. Let’s take WHO AGQ threshold as objectives! Yet if we want change, we should consider the following objectives:
- Focus our community on what really matters in life.
- Allow us to measure our progress towards those goals.
- Enable large groups to work together in alignment (to start reducing NOx, CO2, PM levels not increasing it).
- Allow us to stretch to achieve things we wouldn’t have thought possible (Realize living conditions with air quality really below the WHO levels).
We cannot start acting without objectives on a global, regional, cities, district and even street level, as there’s a high urgency everyone starts acting in its own context at home or at work.
If we want to make cities more healthy and lively again, reducing the cost for society, we need to start measuring everywhere. And in order to be able to measure everywhere, the measurements or their measurement devices should be cheap enough. This perspective covers a set of technologies that Verhaert masters and which we would like to share.
Optical measurement technologies
Lots of possible measurement technologies do exist like ODS, laser diffraction, scattering, ring-cavity … Although Verhaert’s OpticsLab has expertise in all of them, we’ll discuss briefly the 3 most common of them:
- LIDAR
- Scattering
- Satellite EO data
The following measurement principles must operate in a closed cavity to avoid disturbance from environmental light, thus making the system mechanically somewhat more complicated. However the scattering principle remains a cheap solution from which many instances are already available on the market.
LIDAR
LIDAR technology has become more advanced with the development of laser technology to include the following remote sensing techniques:
- Elastic-backscatter LIDAR
- Coherent, Raman or Doppler LIDAR
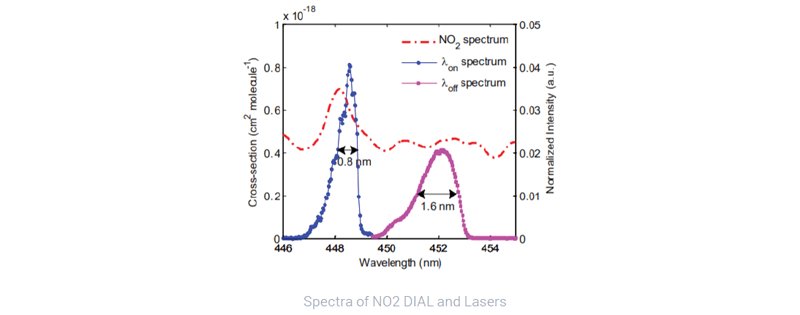
Elastic LIDAR measures the changes in magnitude of the reflected light, while coherent and Raman LIDAR provide information on changes in the wavelength of the reflected light. Differential Absorption LIDAR (DIAL) was developed primarily for the spatial measurement. Typically it contains a spectrally separating optical component, directed into the detector.
The DIAL measurement is achieved by the direct impingement of the laser beam on these materials and its subsequent reflection and scattering. All LIDAR applications use fairly high-end laser and optics. They’re typically designed to measure over long distances and to achieve high precision measurements as requested by Earth Observation Laboratories or Meteorological Institutes. Technological advancements in this field are still made today for specific performance challenges. Chinese investigators developed in 2017 a lower cost DIAL system with a detection sensitivity of ± 0.9 ppbv (parts per billion by volume) at 95% confidence level in the region of 0.3-1 km.
Scattering
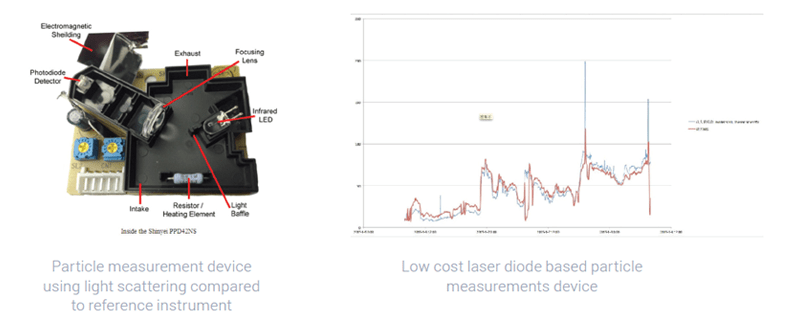
Laser diffraction or scattering is often used to count particles and determine their size and concentration in the air. When a laser beam strikes a particle, the beam’s light is scattered in all directions. A light detector (or ‘photometer detector’) measures all of this scattered light. Larger particles scatter the light more than smaller particles. An algorithm determines how many particles are in the sample, and how big they were. These sensors are able to measure concentration of near microscopic particles ranging from 0.5μm (and sometimes a bit lower) up to 10μm.

An analysis of the histogram plots shows that the pulse height (amplitude) has a direct relationship to the size of the particle. The sensor outputs larger pulses (higher ADC Code bins) for larger particles. This result could be expected considering that larger particles will scatter more light compared to smaller particles. The figure below shows the histogram of ADC Codes for Smoke Particles and dust.
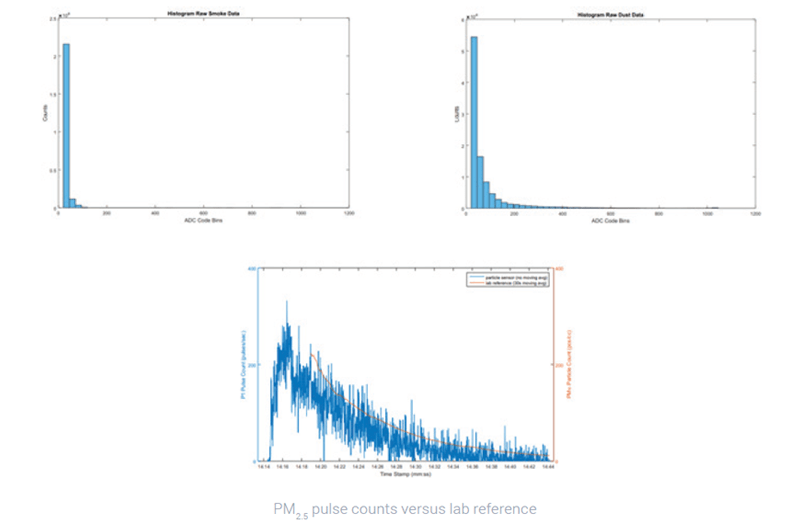
Sensor detection pulse’s amplitude is related to particle size and sensor detection spacing between 2 pulses (i.e. frequency) is related to particle concentration. The software algorithm estimates the concentration of particles flowing through the sensor by measuring the pulse amplitude and spacing between pulses detected. As the PM2.5 definition includes only particles with a diameter of 2.5 μm or less and as particles above 2.5 μm will generate a pulse that meets a higher amplitude, a threshold can be set to identify particles smaller than 2.5 μm. These kind of systems can be built with low cost photodiodes, laser diodes, filters, low cost lenses and appropriate processing electronics, but will only be accurate through calibration.
EO data – Satellite based measurement
Why bother about you having a proper measurement device when EO satellites (Earth Observation) can offer a free of charge solution. Different scientific instruments aboard NASA and ESA’s EO satellites assess the Aerosol Optical Depth (AOD). This is a measure of the degree to which aerosol particles prevent the transmission of light either through absorption or scattering. Several studies have developed algorithms and models to relate the AOD measures to ground-based measurements of particulate matter and gases like NO2, CO, O3, SO2 … Of course, relating these atmospheric column measurements to ground-level measurements is tricky and depends on the vertical structure, composition, size, distribution and water content of the atmospheric aerosol.
NASA has several EO satellites like AURA, AQUA, CALIPSON, LANDSAT and TERRA. The first of a kind Moderate Resolution Imaging Spectro-Radiometer (MODIS) mounted in the TERRA and AQUA-satellites measures spectral radiance from 412 till 14.200 nm enabling a lot of spectral based gas concentration measurements. Results indicate that the mean differences between PM2.5 reported by ground monitors and PM2.5 calculated from the satellite overpass times during cloud-free conditions are less than ± 2.5 microgram (-3), although this value varies by season and location. TERRA was launched already in 1999, and AQUA in 2002. In polar orbit, approximately 700 km above the Earth, MODIS views a swath of approximately 2.300 km resulting in near daily global coverage of Earth’s land, ocean and atmosphere system. Air pollution from Aerosol products are reported at 10 km resolution. NASA’s EO details can be found on search.earthdata.nasa.gov.
But also ESA has a large EO satellite track record: PROBA-V (developed, built and commissioned by Verhaert in 2013) and Sentinel 1-3. ESA recently (October 2017) launched its Sentinel-5 Precursor – also known as Sentinel-5P – the first Copernicus mission dedicated to monitoring our atmosphere. It has been built to map a multitude of trace gases such as nitrogen dioxide, carbon monoxide and methane that affect air quality.
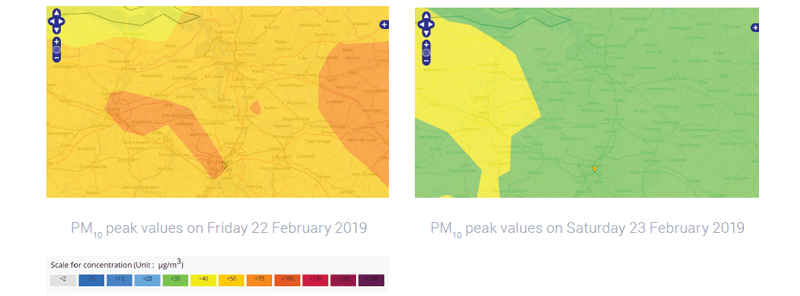
Carrying the Tropomi instrument, the most advanced of its kind, Sentinel-5P maps the entire planet every 24 hours. What sets Tropomi apart is that it measures in the ultraviolet and visible (270-500 nm), near-infrared (675-775 nm) and shortwave infrared (2.305-2.385 nm) spectral bands. This means that a wide range of pollutants such as NO2, O3, CH2O, SO2, CH4 and CO can be imaged more accurately than ever before. With a resolution as high as 7 x 3.5 km, it has the potential to detect air pollution with a district precision. Images of the central part of the Flemish region for a working versus weekend day are given below.
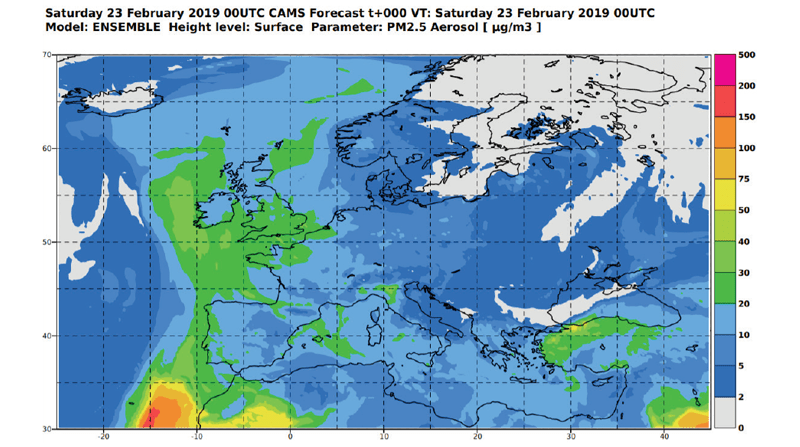
Of course using historical data, air pollution forecasting models exist f.e. ENSEMBLE model. Now given for PM2.5 for Europe.
With all these great technologies it becomes possible to monitor what’s important to us. Yet it’s only through building new specific applications addressing needs for users in the streets, applications for districts, managing cities and regions that one shall capture value in through air quality monitoring.
Acting collectively and stretching together to achieve reductions
in air pollution.
If we can get large groups working on finding viable and valuable products, we can switch from measuring to reducing NOx, CO2 and PM levels, not increasing them. If we act collectively, we still can limit the pay back of air pollution.
Performance criteria and test procedures for certified Automated Measuring Systems (AMS) for ambient air quality for gases and PM are defined in:
- EN 14211:2012 for NOX
- EN 14212:2012 for SO2
- EN 14625:2012 for O3
- EN 14626:2012 for CO
- EN 14662-3:2005 for C6H6
- EN 12341:2014 for PM10
- EN 14907:2005 for PM2.5
- EN 16450: 2017 for PM10 and PM2.5
Download the perspective