Hypertension, hypotension or irregular blood flow are linked with various diseases like coronary heart disease and ischemic as a hemorrhagic stroke. The WHO reported that around 13% of all deaths are caused by high blood pressure values. The overall prevalence of raised blood pressure (adults aged 25 and over) is around 31% (T.Mills K. et. All., 2016). Verhaert’s AILab invented a breakthrough AI-platform to track continuous blood pressure from data created by a PPG-sensor (photoplethysmogram). This as an alternative of the traditional sphygmomanometer to implement in future applications.

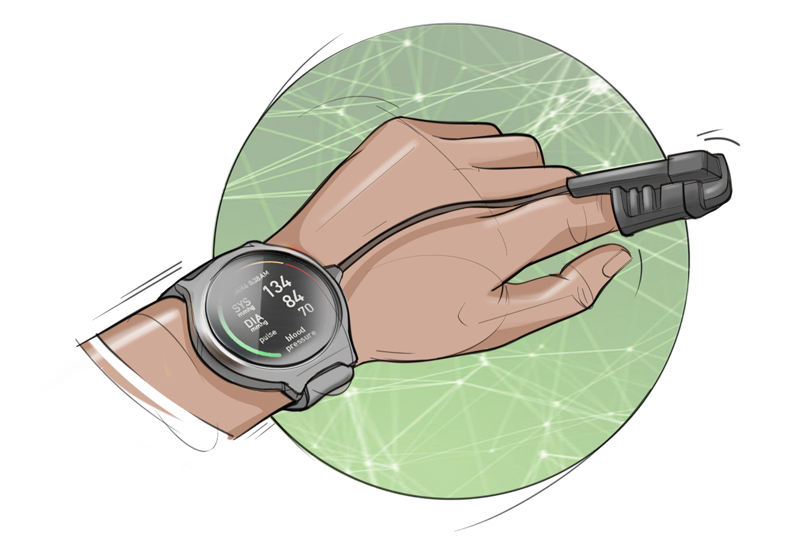
So you can measure your blood pressure with your smartwatch?
Many people are daily tracking there blood pressure (BP). Mostly measured to get insights into their health condition or to communicate with their doctor for follow-up. Nowadays they measure their BP with a sphygmomanometer, a tool with inflatable cuffs. The main problem? It isn’t a user-friendly measuring tool, also faults are easy to make due to wrong placement, and it’s only a single moment measuring.
Experts stress the importance of accurate blood pressure screenings. – Journal of the american college of cardiology
To cope with these challenges and start from an integrated product development perspective, Verhaert wanted to create an AI-solution that could work with the dataset of one sensor. This to fit into the already known applications like smartwatches, but also because it makes it a lot easier to implement in future applications.
Use of the PPG signal
Literature studies have shown that there exists a relation between the morphology of the PPG signal and the BP. The PPG signal is a periodically-repeated cycle measuring the blood volume changes in the blood vessels. The change in blood volume is driven by the beating of the heart. When the heart muscle contracts during systole, the BP increases, and the PPG signal shows a first peak, the systolic peak.
When the heart relaxes to fill with blood during the diastole, the BP decreases, and the PPG signal shows a second peak, the diastolic peak. The systolic peak is always clearly visible in the PPG signal and is often used to determine the heart rate. The diastolic peak is often more difficult to detect properly in the PPG signal. However, a PPG sensor has the potential to calculate both parts of the BP.
AI-solution
The algorithm that Verhaert’s AILab created over the last 3 years is using “deep learning”. Deep learning is a subpart of machine learning and Artificial Intelligence where multiple artificial neural networks are stacked on top of each other to create a deeper neural network.
We employ supervised learning which means that we need (training) data that has for each input PPG signal a corresponding blood pressure value, which is the output of the algorithm. This research is made out of 2 different datasets. The first dataset used for training our model is the freely-available MIMIC II (Medical Information Mart of Intensive Care). After preprocessing the dataset consists of 1.862 patients. This dataset is split than into 3 groups: training, validation and testing ). First a set of data is to create the algorithm. Secondly another set data is used for validation to prevent “overfitting”. Overfitting is the phenomenon that the algorithm only works with the training data set. This is prevented by using the validation group as a reference, while training the algorithm. The test-group is being used after the training of the algorithm to test the performance.
In a second wave, we trained our algorithm with a clinical dataset that is produced in the light of this development. For this, we worked closely together with the University of Leuven and the University Hospital of Leuven. The clinical dataset is created by measuring the PPG on 3 different spots while the patients were sleeping. The intended use of this dataset is to determine how well the algorithms, created on the MIMIC II dataset, perform on new and other data. The PPG was monitored on 3 different body spots: the finger, wrist and upper arm.
To make it possible to obtain proper data we used different PPG sensors depending on the position. There are other requirements linked to every body part. This is different in terms of LED color-wave length, reflection or transmission sensor … For every body part there are always pros and cons. The algorithm of the device has to be trained on these specific circumstances.
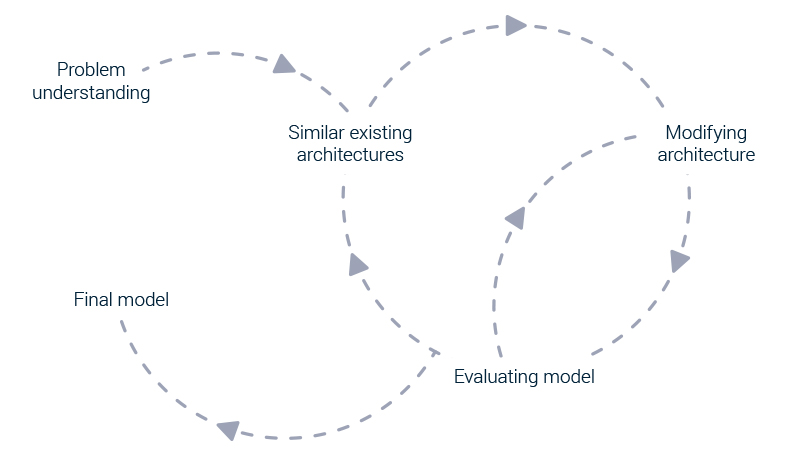
Another important factor beside is the expected movement of the device related to the activities of the user. These parameters have an impact on the accuracy of measuring. Parallel with creating the clinical dataset, the algorithm was developed. Every creation of new algorithms starts with problem understanding. In this case, a regression problem, because we want to predict the systolic and diastolic blood pressure. After this phase, you research the existing architectures of algorithms. This is based on the literature that has been found on the topic or on similar topics. Remarkable is that concerning the prediction of the blood pressure given a PPG signal, the literature almost always calculates some features first, before predicting the blood pressure. This is one of the paths that has been researched in this project, but the main focus will be the featureless approach. The algorithm must calculate the blood pressure directly from the signal.
The development of the algorithm consists of multiple iterations with each iteration trying something different or tweak applied to it. The first iteration was designed to determine the optimal depth of the deep neural network to predict the systolic and diastolic blood pressure. The deep neural network has a unique block of convolutional layers that can be stacked on top of each other to create a deeper network. In the third iteration, we tried multiple different input combinations. Until the third iteration, the input to the algorithm consisted of 1 PPG signal. The third iteration tried 3 different inputs to the algorithm: the PPG signal along with its first and second derivative, 8 consecutive PPG signals in a channel-wise fashion, 8 consecutive PPG signals with its first and second derivative.
As a result, we have 2 algorithms developed: one for the systolic blood pressure and one for the diastolic blood pressure. To predict the BP there was only the need of 8 consecutive PPG segments. This way of working is unique compared with the research in the same field. We found out that this number of segments, gives accurate predictions when used to build up the algorithm.
Calibration
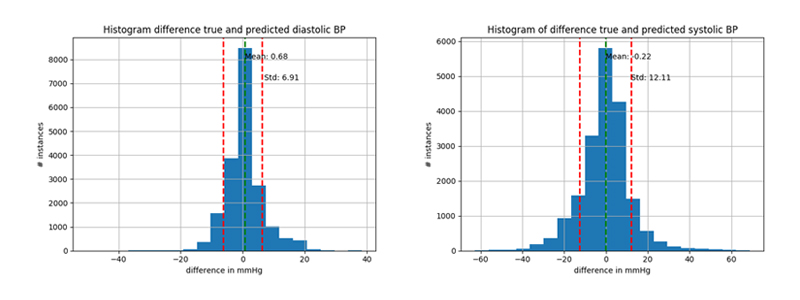
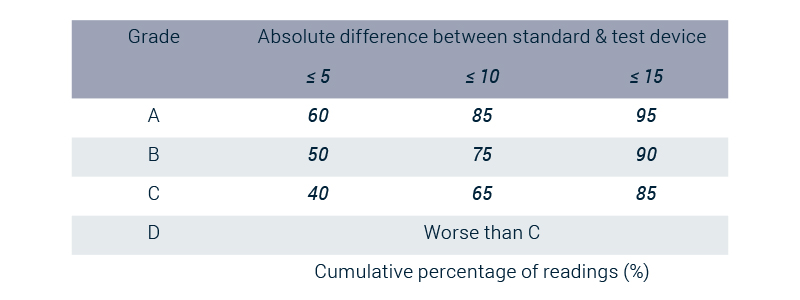
Important to notice is the role of calibration. Because every person is physically different in many ways, calibration can make the algorithm extra accurate. Calibration allows for adapting the algorithm to a person’s subtle differences in the morphology of its PPG signal. This accuracy is described in a system of grades. The grades usually used are those from the British Hypertension Society. The goal of this research was to get the same or higher grades compared with the current methods. Without calibration, the algorithm is capable to receive the grade A-C/D (diastolic-systolic) (It was close to grade C). If we add calibration, the algorithm is capable to receive the grade A-A/B (A or B, influenced by specific conditions). The use of calibration depends on the intended use of the application.
During the development trajectory, many aspects have been covered while implementing this algorithm. Other aspects to be considered are e.g. the computing power compared with the battery life, user ergonomics, connectivity with other devices like a smartphone … so an integrated development approach is needed to create a unique solution.
“The future is now” and the use of AI for these applications creates a lot of opportunities in the future of healthcare and telemedicine.
So if you have any questions or are interested to know more about this breakthrough technology, we’re glad to help.
Download the perspective
Looking for solutions to innovate?
Leave us your email and get in contact with Wouter Hendrickx, Business Development Manager Solutions Smart Medical & Health, to help you with your innovation process.